
Taking the pain out of evaluating Paywall AB tests - Part 1
Selecting your REAL success metric, and how to calculate it.


Ever felt unsure or confused in trying to interpret your Paywall AB test results?
Then this article is for you.
I’ll cover:
What are the most common sources of confusion
Which success metric makes the most sense
How to calculate that metric
This should be useful for anyone with a stake in paywalls:
Founders
Junior-Senior Product/Growth folks
Growth-curious or product/growth adjacent roles
Why did I write about this?
A couple of recent events lined up:
I’ve noticed Founders that I’m mentoring are often unsure which metrics are the best measures of “success” in the context of Paywall AB tests, or have misinterpreted what different metrics truly mean.
An executive I worked with checked the results on one of our tests and declared “It’s a resounding success, with a 45% uplift!” (Realised LTV was up [1 - See Appendix] , but that’s not a good success metric in most cases)
I suspect these issues are fairly widespread.
The situation: Evaluating Paywall AB tests is confusing and hard
You’ve just stopped your test.
The dashboard has about 25 metrics.
Some of them are “red”, some “grey”, with varying percentage changes and the product you’re using declares some of them to be “statistically significant”, and others not.
Generally, one question matters the most [2]: Are we going to make more money?
Unlike AB testing CTA button (Call to Action) copy on a landing page, answering that key question gets us into deep complexity, due to three main problems.
First problem: Many potential success metrics are thrown at you
What do you pay attention to, when the dashboard lets you filter by 20 metrics? Let’s skip the denial, anger, confusion and go straight to acceptance.

There’s a lot to process here, most of it noise, and we’ll look at what should matter the most to you.
Second problem: Many secondary factors that affect results in less obvious ways
A non-exhaustive list of potential influencing factors beyond the the raw metrics:
Your customer retention curves and how they affect the LTVs, and thus the real value per conversion - without weighting our different types of conversions (e.g. monthly vs yearly) by the long-term revenue we gain, conversion data can be highly misleading
Note: This is IF you even have solid data on this yet! We didn’t, but I can show you how to make a well-informed estimate 🦄
Your business & product strategy - It could be that monthly customers fit more of a legacy ICP (Ideal Customer Profile) before you pivoted into longer-retaining yearly plan customers, who fit your current ICP. Conversely, maybe customer base growth is actually your target within your strategy, and other metrics are secondary.
Refunds - Yeap, it’s a thing! These tend to happen more frequently for trial → yearly subscriptions than monthly, and if you’re not 100% sure they’re automatically factored in to whatever reporting you’re using, it could be a decisive factor that you need to account for. (In my experience trial → yearly conversions can have up to a 10X higher refund rate than monthly conversions 🤯.)
Third problem: Your tools are trying to help, but are only as useful as your understanding of how they work
I feel uneasy declaring outright that they are lying to you. A closer analogy is they’re giving you 1 part signal, 9 parts noise.
The issue stems from AB/Paywall/Billing tools becoming more user-friendly, and doing work on your behalf that would have taken a deeper expertise in the past, they’re taking shortcuts to understanding that is crucial when making such pivotal decisions.
You’re likely dealing with one of the following:
A paywall tool that handles your AB testing, and tries to help you a little bit in giving you the numbers and the change, but can’t tell you which of these is the most important for you
A paywall tool that handles your AB testing, and goes as far as to give you a list of metrics, magnitude of change & “confidence” or highlights “statistically significant results”.
Please be very skeptical of these declarations - single metrics are almost always useless alone, and also scanning a long list of 15-20 metrics almost guarantees one will hit “stat-sig” due to the “Multiple Hypothesis Testing” problem
Something even less sophisticated e.g. a basic in-house tool, or manual data export where you have to do all the heavy lifting
All 3 of the above examples need varying degrees of “help” to be useful, especially so if you don’t have multiple years of data to go from.
Help I’m here to give you :)
Guidance on how to calculate success
What’s the most important metric?
In most cases, you’re looking to optimise with a laser-focus on New LTV per user
LTV is typically defined as how much revenue we expect to make per new user over a given timeframe - usually 12 to 36 months. (or proceeds i.e. Revenue minus Platform fees e.g. Appstore/Playstore commission).
The “user” in this case, is potential customer who has been exposed to the Paywall test.
Note: Reminder that this is is vastly different from “Realised LTV per user/customer/account” [1].
Why LTV and not Conversion Rate, New MRR or any other metric?
As mentioned earlier, how well your customers retain in each subscription, and thus the amount of revenue you’re able to capture from each one throughout their lifetime as a customer of yours, has massive impact on their relative value to your business.
Who cares about how much money we collect from users in month 0. If you plan on being in business past the next 6-12 months, you should very much care about the long-term picture.
At this point it’s conventional wisdom that yearly customers/revenue are worth more than monthly, but by how much can differ drastically depending on your industry, target customers etc.
In my personal experience, with a yearly plan that’s discounted ~20-40% from the annualised monthly price, the yearly usually has ~2:1 or greater advantage in LTV - in other words, the yearly customer is worth ~2X+ to you.
Whether you need to dive into this complexity depends heavily on your setup:

If you’re in the first two cases (single plan with or without trial), you probably don’t need help. Conversion to paying is your success metric, and then at most you should pay attention to see if those cohorts retain as well.
What if we’re in the 3rd category?
Most SaaS products are, and this is what I want to help you solve.
When multiple plans come into play, we need to get our hands dirty with LTVs, and manual calculations.
The basic formula is as follows:
(Plan A LTV * (Plan A Conversions - Plan A Refunds) + Plan B LTV * (Plan B Conversions - Plan B Refunds))
ALL of the above divided by Users in the variant
Or visualised:
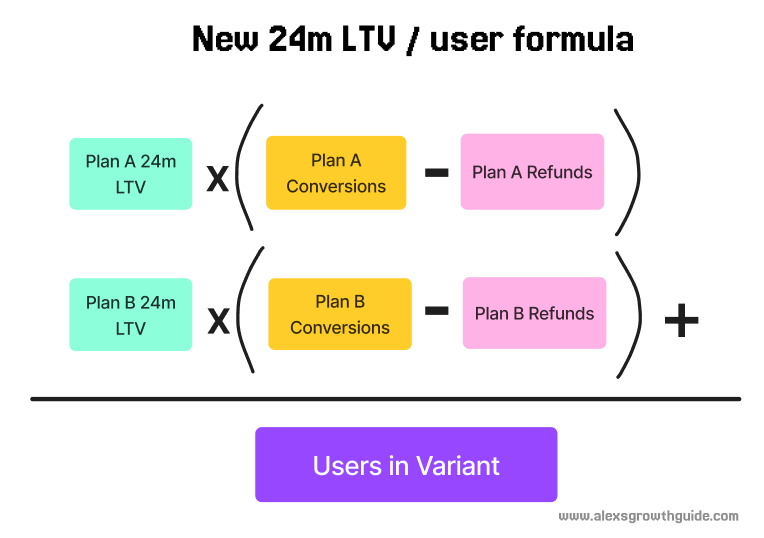
We do this for the control, and each variant we have to calculate which is making us more money per user.
The most tricky thing here could be determining LTV, especially if your product is new.
How to determine LTV
If you have a lot of retention data and an easy to use billing system e.g. RevenueCat or similar, you should be able to report on this directly.

If you have a fancy billing system AND plenty of data
Step 1: We need to find “24 month Realised LTV per paying Customer”.
Why 24 months?
Anything less is basically useless, since after 12m non-cancelled yearly renewals are counted, but monthly doesn’t have the rest of the second year to catch up.
36m is a long time and very speculative without a deep history of data. For more established products where these numbers are well understood, it makes sense to extend the LTV window, but I’m targeting earlier stage products here.
If you have 36m+ of data, then it’s also fine to increase this timeframe. I’ve worked on products where we had the data, and the plans were fairly stable over time, so 36m was the standard.
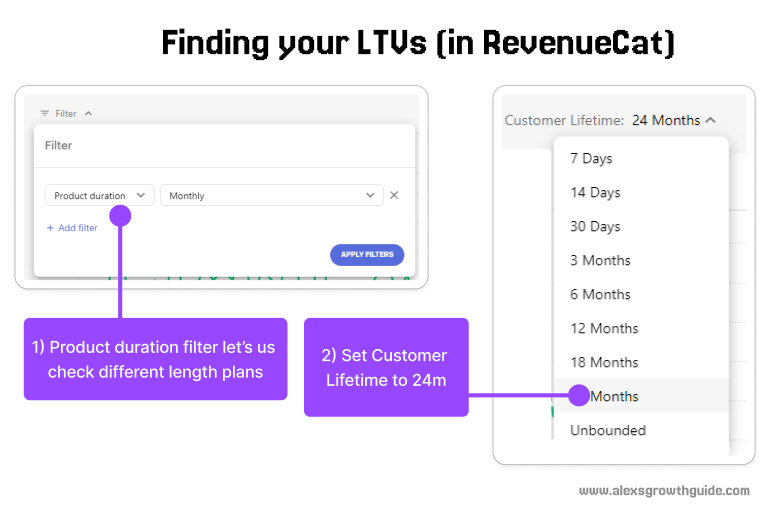
Example below is RevenueCat:
We want the “Realised LTV per paying Customer” report
Filter by Product duration
Set Customer Lifetime to 24 months
Repeat for all other subscription lengths
Next, you take those LTV numbers, and plug them into the formula with conversions & refunds for each variant in your test.
Example
Monthly 24m LTV = $50
Yearly 24m LTV = $100
Control:
500 monthly conversions, 25 refunds
300 yearly conversions, 30 refunds
20000 users during the test
Variant:
450 monthly conversions 20 refunds
375 yearly conversions, 40 refunds
20000 users during the test
Control 24m LTV / user = ( $50 * (500-25) + $100 (300 - 30) ) / 20000 = $2.54
Variant 24m LTV / user = ( $50 * (450-20) + $100 (375 - 40) ) / 20000 = $2.75
While conversion to paid is +3% for the Variant here, the actual New 24m LTV performs ~8% better.
If you don’t have a fancy billing system or 24m of data
Don’t worry, I’ve got you covered. 😉 At time of writing, we have ~7 months of data at Linearity, I needed to extrapolate to get usable LTVs.
This LTV calculation/estimation, my personal spreadsheet calculator for AB tests, and a full guided example on how to use it will be covered in Part 2
I will be sharing the spreadsheet I use to determine Paywall AB test success, which does all of these calculations for you, as well as an LTV calculator.
Sneak peak:

Summary & Cheat sheet
Determining Paywall AB test success is complex, but with the right support it should be manageable for all who are responsible for driving success there.
New LTV per user should be our primary success metric, over and above the dozens of other metrics that we see in our dashboards, except in very simple scenarios.
The formula:
(Plan A LTV * (Plan A Conversions - Plan A Refunds) + Plan B LTV * (Plan B Conversions - Plan B Refunds))
ALL of the above divided by Users in the variant
It’s necessary to have a fairly accurate LTV per paying customer to calculate this
What’s next?
This is Part 1 of 2 on evaluating Paywall AB tests.
In the next part, I will share my personal spreadsheet calculator, and practical examples on how to use it (+estimating LTV for use in the calculator).
Appendix
[1] Note that Realised LTV is very different to true LTV, and simply means revenue collected, rather the amount of revenue you expect to collect over a defined customer lifetime. By its nature, Realised LTV undervalues monthly subscriptions. If you have multiple subscription lengths, especially up to yearly, Realised LTV is not going to be very helpful.
[2] : Generally, some kind of LTV should be your main goal, but it’s perfectly valid if a business is optimising for certain types of subscriptions/customers, or simply higher growth in paid users at the expense of other metrics.
Glossary
LTV = (Customer) Lifetime Value = Average (Mean) revenue collected from each paying customer
AB Test = A quantitative experiment, where we split traffic to 2 or more versions of an experience, to measure the difference between them
Realised LTV = Revenue collected to date e.g. from test, or cohort state date
24m LTV / user = Expected LTV revenue collected per user over a 24m period, user being defined for example as when “New user who has seen paywall”
CTA = Call to action = Shorthand for a button that is calling the user to action, e.g. Subscribe to my newsletter!