
Taking the pain out of Paywall AB tests - Part 2 - My personal success calculator + how to use it
Guided examples using my personal spreadsheet calculator

Recap from Part 1
Evaluating Paywall AB tests accurately can be difficult due to complexity and sheer number of potential metrics
New LTV/User is our #1 success metric for these tests, which is how much revenue we expect to make per user who sees the paywall, over then next X years - (Usually at least 24 months but can be longer)
It’s necessary to have an accurate LTV per paying customer in order to calculate this
What we’ll cover in Part 2
Because we have to prep the right data, the next sections are on making sure we have our customer LTVs ready to use in the Main Calculator.
Main points:
Estimating LTV for use in our calculations
Using the Main Calculator
Evaluating success
Choose your own adventure
LTV Preparation:
For those with more than 24 months of subscription/retention data AND your billing system can report on this for you → See “Tips on how to find your LTVs” section from Part 1
For those with more than 24 months of subscription/retention data, BUT the system doesn’t calculate it for you → Read on to the next section “Estimating customer LTVs with the LTV Calculator (when you have >24 months of data)”
For those with fewer than 24 months of data → skip to “Estimating LTVs when you have <24 months of data”
If you already have your customer LTVs ready:
You can skip straight to → “The Main Calculator”
Estimating customer LTVs with the LTV Calculator (when you have >24 months of data)
Firstly, what does it do?
You put in retention & subscription value data, and it gives you 24 month LTV values to use in the Main Paywall AB Test Calculator.
Note: The LTV calculator works up to 36m estimated LTV, but I think in general 24m is a better middle-ground to use for the actual AB test calculator in most cases.
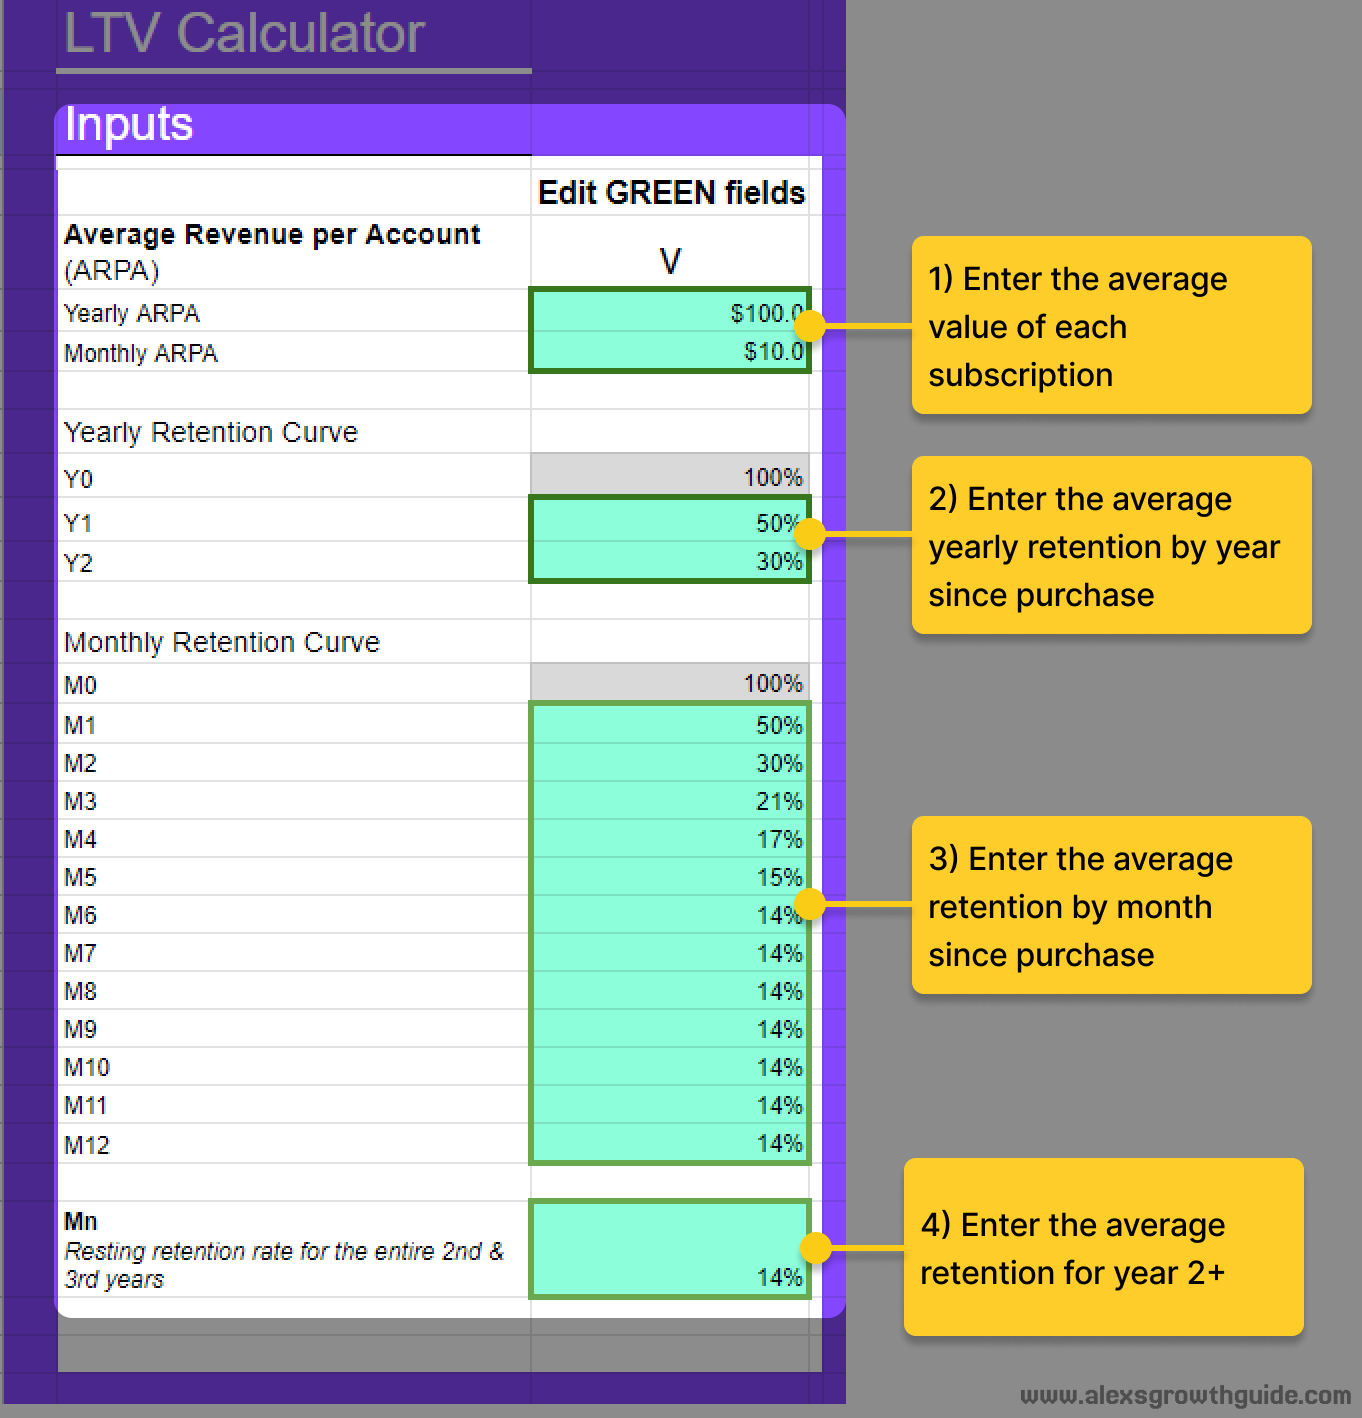
First, you need some kind of “Subscription/Cohort Retention” report, which can give you a relative % retention by period after initial subscription period. Essentially it means “What % of customers still have active subscriptions in Month/Year n after their first subscription”
Second, you need ARPA/ACV (Average Revenue Per Account / Average Contract Value) for each subscription type - it’s simply the average (mean) value of each paying customer
Next, we enter the data into the calculator as below:
Then on the right side of the sheet we have the outputs:

✨And that’s how you use the LTV calculator ✨
Now you have your customer LTVs ready, you can now skip to “Using the Main Calculator”
Estimating LTVs when you have <24 months of data
Example: You launched paid plans ~3 months ago
Assumptions:
You’ve got two subscription lengths, monthly + yearly
You know what % of monthly customers have churned from that first monthly cohort in months 1 & 2 after month 0 (first purchase month)
You know what % of yearly customers have already canceled / turned off auto-renew for their subscription
Estimating Monthly Plan LTV
3 months of data on your first monthly cohort, and the retention of this cohort looks something like the below, dropping to 50% in M1, and 30% in M2
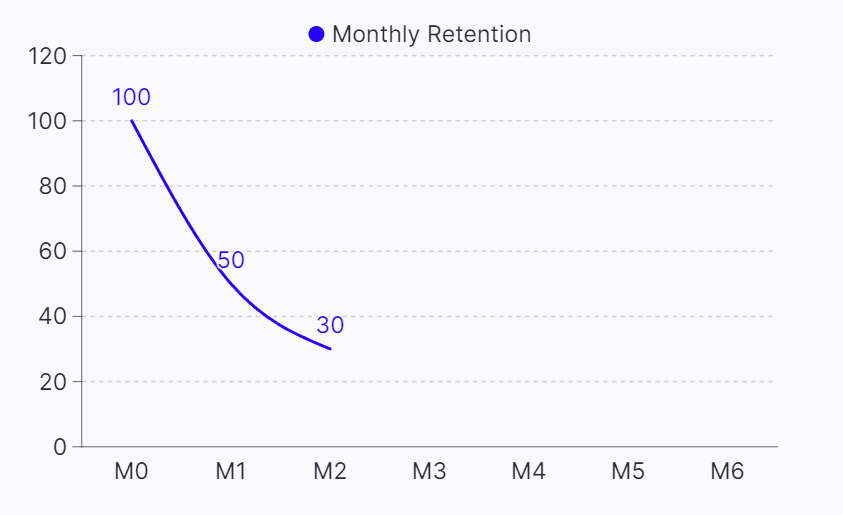
This puts us at a relative 50% loss in M1 (50/100), and 40% loss in M2 (= 20/50), so we can build some rough bounds around what is a likely range of outcomes here.
We’re already seeing a relative slowing from 50→40% churn in M0→M1→M2. Assuming your product is solving an ongoing need, and most of the losses you make in M0/1 are due to lower intent/willingness-to-pay/product-market fit users, then the relative churn will tend to slow down somewhat.[1 - See appendix for more]
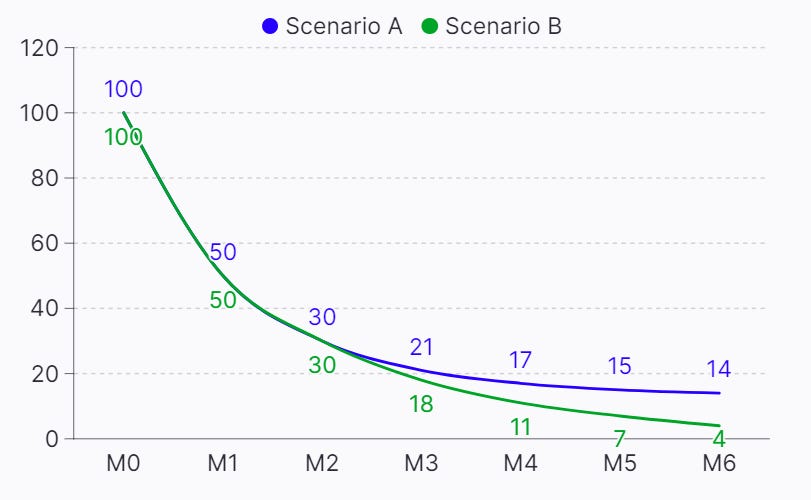
Below I outline a couple of potential scenarios based on those first 3 months of data.
Scenario A (optimistic): Churn slows down from 40% to 30, 20, 10%
Product solves ongoing need
Retention flattens out at a higher number
Scenario B (pessimistic): Churn stays at 40% relative until M6
The vast majority of monthly customers don’t need, or don’t want to choose your product in the long-term
Retention flattens out at a very low number

Reality is very likely to lie somewhere between these ranges. Looking to our 24m estimation, let’s assume retention remains relatively flat after 6 months. It’s possible there’s churn to zero, but if the product is designed for ongoing use, that isn’t the most likely outcome.
Assuming flattened retention at 6 months, we get something like the below graph:
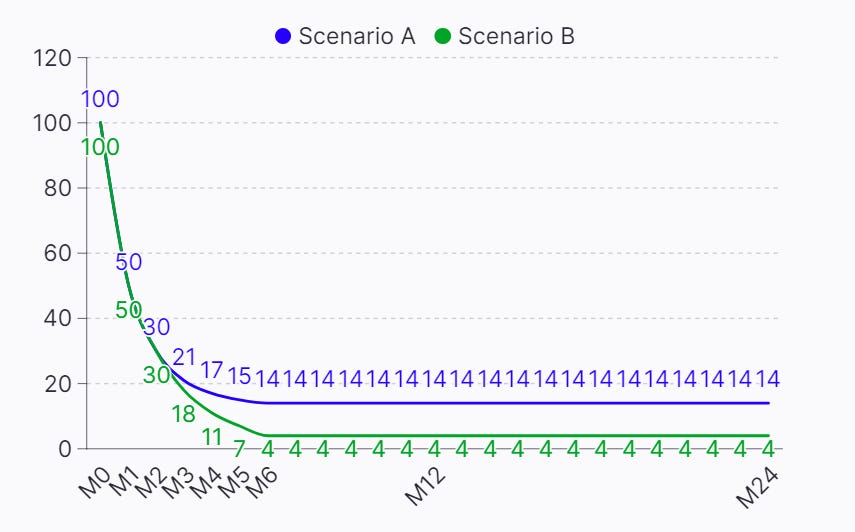
The LTV we collect, is effectively the area under the graph here, and you might be surprised at the difference between these two.
Let’s enter the numbers as shown below and see what comes out:
What would you guess Scenario B’s advantage to be?
30% more?
50% more?
.
.
.
It’s 70% more revenue collected over the 24m timeframe.
After repeating this for both, we get:
Scenario A: $29.2
Scenario B: $49.9
A relatively small looking change in assumptions can create a HUGE difference when it comes to retention & LTV. This can be dangerous when making significant decisions like “which paywall design to go with” that may favour one plan or the other.
In my personal opinion, I’d split the difference between Scenarios A & B, something like $35-$40 for monthly, and update the value as each new month of data brings us more clarity. Perhaps even closer to B assuming the worst, since undervaluing shorter terms is a less harmful mistake to make.
The rule of thumb is longer subs will be worth more, but there are certain types of products where they are designed to solve a time-limited use-case, and there might be strategic value in that e.g. an App that supports a weight-loss journey that aims to have you achieve a certain result within 3 months.
Estimating Yearly Plan LTV
Since it’s been less than a year since launching your plans, you don’t have any renewal data. How can we best make an informed guess about this?
Cancellation numbers up to this point
Some % of customers will have already turned off auto-renewal, and it’s safe to say that the vast majority (let’s round it up to 100%) of those won’t turn it back on
Benchmarks. An amazing resource is Lenny’s Newsletter issue on retention benchmarks. It’s going to heavily depend on where you’re playing, let’s assume B2C consumer SaaS.
Note: Technically, this is Net Revenue Retention, which is a measure of retained revenue (as opposed to % of customers or accounts retained), which factors in the possibility that some accounts expand after a year, which drives up the overall number, but I think it’s good enough.

Intuition & Guesswork
Typically there are cancellation spikes at the beginning and end of the billing period, with relatively even increase in cancellation during the middle.
For yearly plans, this can look like a huge spike during the first day(s), another spike in the last weeks before renewal (especially if customers receive a reminder).
Since this can vary so wildly depending on industry, product, customers, plans etc., there’s no simple formula or calculation for this (as far as I’m aware).
Note: At time of writing, some billing systems are experimenting with features to predict LTV, since they’re realising they can do so with the data from thousands of business customers. You can read how RevenueCat’s new Prediction Explorer works in that way.
Example:
If you’re launching a new product in this space, let’s assume our baseline assumption is somewhere under the “Good” benchmark of 55%, say roughly around 40%.
If 30% have canceled at 3 months, 70% is our absolute ceiling with 9 months to go. In this case 40% might be a fair range.
If 60% have canceled at 3 months, 40% is our absolute ceiling, so we could be looking more in the area of 20%
Using the Main Calculator
My spreadsheet calculator that I use, to help you make better decisions
This is a more readable version of what I already use live, and while I tried to keep it simple, there’s a necessary level of complexity here that needs explanation.
Features:
Calculates the most valuable success metrics for you
Includes an LTV calculator sheet to help you estimate Predicted LTVs, which is especially helpful for products where you don’t have 1-2 years of data already
Reduces stress headaches (maybe)
Limitations:
IMPORTANT: In the interest of simplification, I’ve taken some unscientific shortcuts in how we declare success. My goal here is not perfection, but improvement over most peoples status-quo in [2 - See appendix]
Only two versions in the test (Control + Variant)
It supports 3 types of subscriptions: Monthly, Trial → Yearly, & Directly yearly*, since this is one of the most popular packaging configurations
Weekly, quarterly lengths aren’t in there to keep the thing a bit more manageable, but in principle this can be extended quite easily.
*Note: Direct Yearly is there for users who have already used trial, since you might be testing paywalls for existing users, not only new ones.
It’s far from exhaustive in the metrics it provides, simply because I believe the vast majority are situationally useful at best, distracting and meaningless at worst for the purposes of determining success.
You can find the spreadsheet here: »»»»LINK««««
Preparing your data
Test Details:
Start & End date of your test
# of users in control + variant

Subscription / LTV details
Example for monthly:
Average Monthly MRR is the same as the Monthly ARPA (Average Revenue per Account) - the average $ per paying monthly customer from the test
Monthly 24m LTV / paying Monthly user is what we’ve derived from the LTV Estimation earlier in the article, OR the LTV Calculator, OR directly from the billing system if we have enough data on that.
Monthly Conversions is how many converted during the test, which may or may not have already been corrected for refunds. I know that some billing systems factor in refunds in their “Conversion to Paid” reports, but not necessarily in the results from the AB test. Double-check with your provider to be sure. If they do factor it in, simply set refunds to 0
Monthly Refunds is how many customers refunded after purchase

Then repeat for the other sections as needed.
On the other subscription sections:
If you are running an AB test on your signup paywall only, and you only offer monthly + trial into yearly, then you can zero out the “Direct Yearly” section, and similarly if you only have yearly plans, you can zero out “Monthly”.
Example below:

These three sections aren’t special in any way, so theoretically they can be mapped to whatever setup you have, e.g. Weekly + Monthly + Quarterly if you’ve got shorter plans
The Results & Success metrics section
Have you got enough data?
This article is targeted at evaluating the results, but I had to include a disclaimer in the sheet regarding sample sizes.
Here’s a link to my go-to pre-test calculator, which you should use to determine test length based on your traffic.
If you don’t have enough traffic to detect a 10-20% uplift within 3-6 weeks (20% is a BIG improvement), then you should reconsider AB testing as a tool for you in the first place.

One “shortcut” that I won’t fully address here is that the main success metric, 24m LTV, is calculated through weighting & transforming conversion metrics, which takes a step away from the basis of binomial split testing. [2 - See Appendix]
Evaluating our primary success metrics
As mentioned in Part 1, our north star is the LTV/User, since it’s the best answer to the question “Are we going to make more money?”.
However, if you’ve got a simple setup (single plan e.g. monthly only), then you don’t really need the spreadsheet, but Overall Conversion Rate is good enough (Success Metric 2).

Is this difference big enough?
As mentioned before, my guidance here is a simplification, and it depends on how you’ve setup your test.
You’re roughly aiming for at least the Minimum Detectable Effect (MDE), which is a key factor in determining how long you need to run your test.
Example
If you’ve set an MDE of 10%, and hit the required level of traffic:
An increase of >10%, it’s highly likely our variant is better
An increase of <10%, down to a decrease of <10%, more or less inconclusive
A decrease of >10%, it’s highly likely our control is better
As mentioned in Part 1, if you’ve set up your conditions pre-test with a trustworthy calculator (for example from Evan’s Awesome A/B Tools), and run it for long enough to get enough traffic, then I do believe this will be “good enough”, and superior to applying the “correct methods” to the wrong success metric.
Another point worth mentioning is that this is just one tool for de-risking a pricing/packaging change. You should already be going into testing your paywalls with a hypothesis in mind e.g. “We believe we’re underpriced because X”, or “This packaging aligns the value we charge for in a better way for our customers”, and the testing helps to strengthen that decision.
It can be correct to reject a change because it was inconclusive, or implement a change because it was at least inconclusive i.e. not drastically negative. Every product’s specific context will be different.
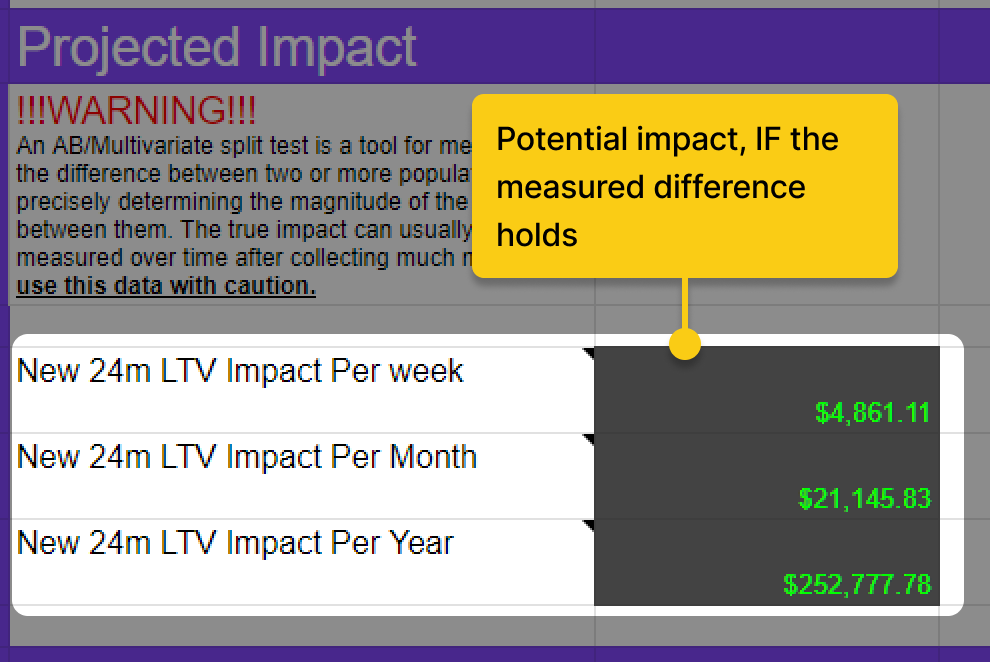
The “Projected Impact” section
I included a “Projected Impact” section to understand the potential of a variant on a weekly/monthly/annualised scale, but this is only if the measured uplift/drop holds.
Continually measure for a few weeks/months afterwards to be sure.
Note: This is difference in New LTV, so the impact “per month” means during the average month of new conversions, we would expect to gain that extra revenue over a 24 month period from those customers.
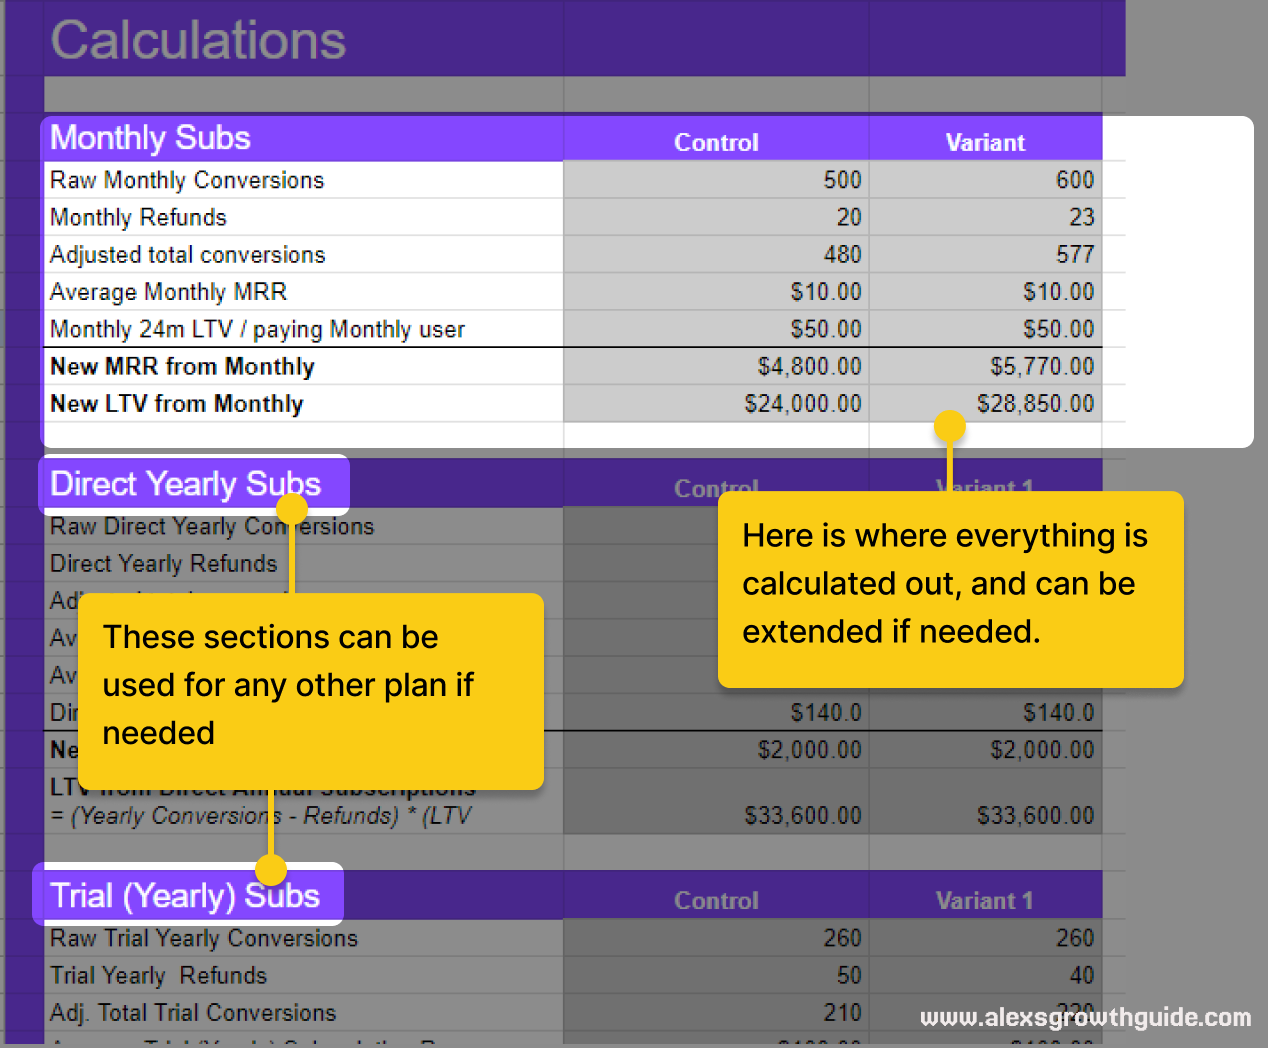
The “Calculations” section
How everything is calculated is out in the open here for your interest.
Summary
New LTV per user should be our primary success metric, because it answers “Are we going to make more money?”
Measuring or Estimating LTV per paying customer is necessary first, and it’s a tameable dark magic that can give us “good enough” numbers
If you can dream it, you can achieve it.
I wholeheartedly encourage you leave feedback or questions you have about what I’ve written here, or the spreadsheet itself. 🙏🏻
What’s next?
I’m preparing a series on Cancellation Flows, a growth “hack” that can have a significant impact. I’ll go in depth on how you can retain a lot more customers without burning bridges, or selling your soul!
Subscribe below if you want to receive more actionable guidance on growing your products.
Appendix
[1] Since we’re talking about a new and unproven product, it’s entirely possible that due to poor product-market fit, activation experience or other reasons that this trends to zero after some time. We will still be fairly conservative with our estimations, and as more data is gathered the estimation will be tuned, so there’s no need, nor is it realistic to be perfect with this.
[2] Normally with AB testing we’re evaluating success purely based on the binary 1 or 0 of conversion, but as soon as we say “Plan A conversions are worth 2X more”, it’s taking a step away from the scientific basis of split testing. My opinion on this, is that if you’re using best-practice sample sizes, then we aren’t twisting the science of it too far, and this is still a big improvement on the status quo for how many teams are evaluating their tests.
To get more technical, the correct way to evaluate a non-binomial value (more than just 0 or 1, convert or didn’t) - LTV Revenue in our case - requires a different methodology altogether, requiring you to easily access the data of each user conversion. I’m assuming in most cases that you won’t have easy access to this. The variance, and standard error of the mean for each variant needs to be calculated, and from this the significance can be calculated. You can read more here if you’re interested.